Why share our own pipeline?
When we talk to clients about CI/CD, the question we hear most often is: "So what do you use yourselves?"
We believe the best way to prove expertise is to show that we use the same practices we recommend. This article takes you behind the scenes of the actual pipeline that delivers enersys.co.th — from a developer’s push all the way to a live website.
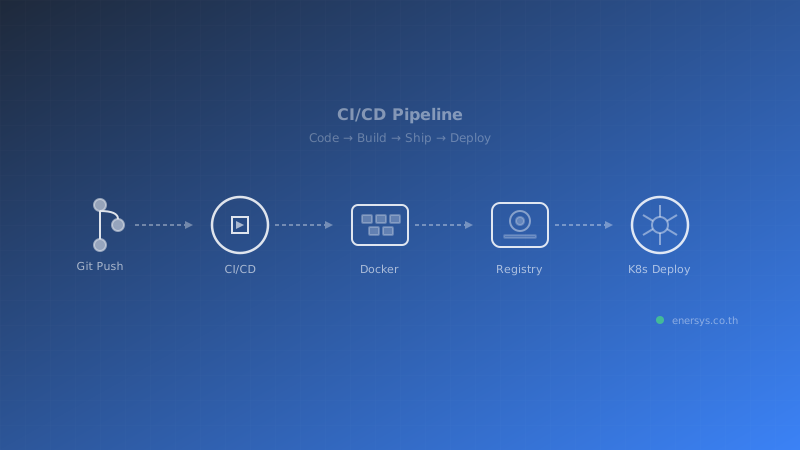
Overview: From code to production
Our pipeline is split into 2 main paths, each triggered by a different event:
- PR Validation — every time a Pull Request is opened, the system builds and tests automatically
- Release & Deploy — when a new version tag is created, the system builds, pushes, and deploys to production
Both pipelines run on a self-hosted runner installed on our own Ubuntu machine — not a GitHub-hosted runner that has to provision a fresh VM every time.
Path 1: PR Validation
Whenever a developer opens a Pull Request, 2 workflows run in parallel:
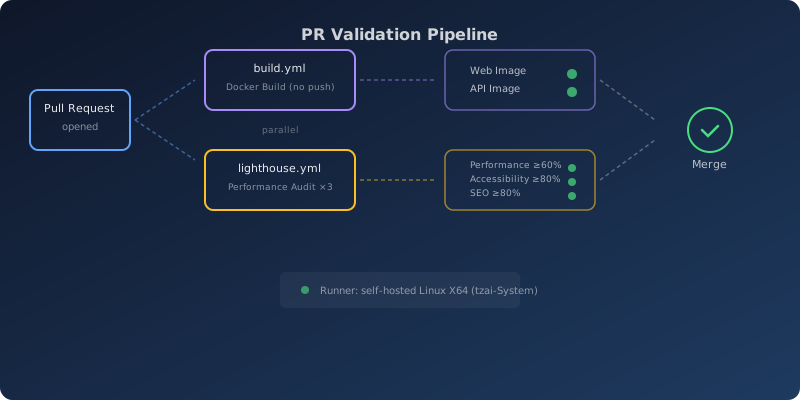
Build Validation
The first workflow checks whether both Docker images (Web and API) can build successfully — but does not push them to the registry. It is a safeguard to confirm that new code does not break the build.
What makes this effective is our use of Docker Buildx cache stored on the self-hosted runner. On subsequent builds, unchanged layers are skipped immediately, reducing builds that would normally take minutes to just seconds.
Lighthouse Performance Audit
The second workflow is more rigorous — it builds the full website and actually serves it on localhost in order to run Lighthouse audits 3 times.
Required thresholds:
- Performance ≥ 60% — anything lower causes the PR to fail immediately
- Accessibility ≥ 80% — accessibility matters to us
- SEO ≥ 80% — the site must be ready for search engines
- Best Practices ≥ 80% — baseline quality standards
The results are stored as artifacts for 30 days, allowing us to track how performance changes across PRs.
Path 2: Release & Deploy
Once a PR has been reviewed and merged, the next step is to create a version tag such as v1.1.178 — this is the trigger that sets everything in motion:
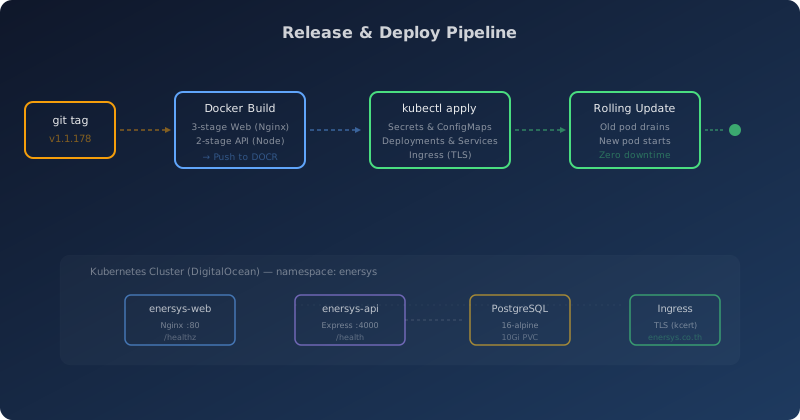
Step 1: Docker multi-stage build
The core of our pipeline is the Docker multi-stage build — a technique that keeps production images as small and secure as possible:
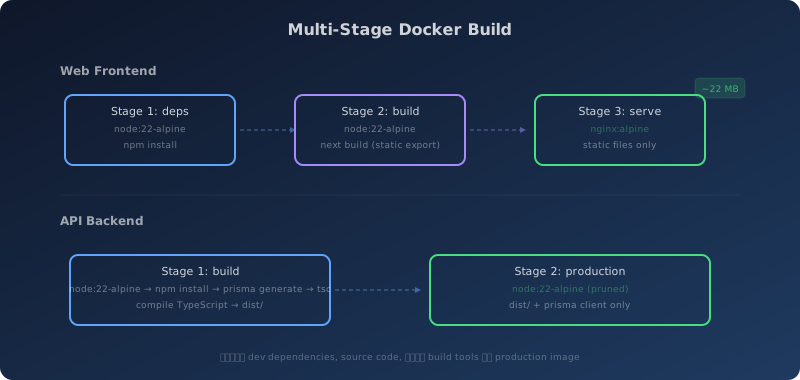
Web Frontend (3 stages):
The first stage installs all dependencies required for the monorepo. The second stage runs the build to export the site as static HTML/CSS/JS. The final stage is the actual production image — Nginx Alpine serving only static files with no Node.js, no source code, and no unnecessary dependencies.
The result is an image of roughly 22 MB — lightweight and fast.
API Backend (2 stages):
The first stage compiles TypeScript into JavaScript and generates the Prisma Client. The final stage keeps only the compiled code, Prisma Client, and production dependencies — removing dev dependencies, source code, and build tools entirely.
Step 2: Push to container registry
Both images are pushed to DigitalOcean Container Registry with 2 tags:
- A version-specific tag such as
v1.1.178 — for rollback if needed
- The
latest tag — for current reference
Step 3: Kubernetes deployment
The pipeline handles Kubernetes end to end:
Secrets & Configuration — secrets are created for the database connection and various API keys (Mailgun, LINE Messaging, Google Forms). Everything is managed through GitHub Secrets, and no sensitive value is hardcoded.
Rolling Update — Kubernetes replaces pods gradually, one at a time:
- A new pod starts and waits until the readiness probe passes (checking
/healthz every 5 seconds)
- Once the new pod is ready, traffic is redirected
- The old pod is drained gracefully
- There is zero downtime
Step 4: Autopublish
After a successful deployment, the pipeline commits the updated Kubernetes manifest back to main, ensuring the Git repository always remains the single source of truth. By inspecting the manifest, we can see exactly what production is running and which version is live.
Real numbers from GitHub Actions: before vs. after self-hosted runner
We are not just saying it “feels faster” — we have data from 49 releases that makes the improvement clear.
Comparison overview
| Metric |
ubuntu-latest (48 runs) |
Self-Hosted (v1.1.179+) |
| Average time |
8.5 minutes |
5.3 minutes |
| Fastest |
6.7 minutes |
5.3 minutes |
| Slowest |
19.0 minutes |
5.3 minutes |
That is a 38% reduction from the very first release run on the self-hosted runner. More importantly than the average, however, is this: the 15–19 minute spikes are gone.
Step-by-step breakdown
Comparing 2 real releases — v1.1.177 (the last ubuntu-latest) and v1.1.179 (the first self-hosted run):
| Step |
ubuntu-latest (v1.1.177) |
Self-Hosted (v1.1.179) |
Difference |
| Build Web Image |
219 seconds |
100 seconds |
-54% |
| Build API Image |
131 seconds |
121 seconds |
-8% |
| Deploy to K8s |
45 seconds |
34 seconds |
-24% |
| Total |
7.1 minutes |
5.3 minutes |
-25% |
The biggest improvement is in the Web image build — more than twice as fast because Docker layer cache persists across runs on the self-hosted runner, whereas ubuntu-latest has to rebuild from scratch each time.
Why did ubuntu-latest spike to 19 minutes?
Data from 48 runs on ubuntu-latest shows that most completed in 7–8 minutes, but 3 runs jumped to 15–19 minutes. The main reason is that GitHub-hosted runners have to provision a fresh VM every time, which can introduce queue delays or temporary network slowdown between the runner and the registry.
A self-hosted runner removes these variables entirely because the machine is always ready, the cache persists, and the network path stays consistent.
Why we chose a self-hosted runner
Based on the numbers above, we moved to a self-hosted runner on our own Ubuntu machine for 3 reasons:
Predictable speed — not only is it 38% faster on average, but more importantly, the outliers are gone. Every deployment finishes within a predictable timeframe.
Persistent Docker cache — Web image build time dropped from 219 seconds to 100 seconds (-54%) because layer cache survives after each job ends.
Cost — it reduces GitHub Actions minutes usage, especially for frequently run jobs (we deploy more than 10 times per day).
Nginx configuration — small details that make a big difference
Our production web server does more than simply “serve static files”; it is carefully optimized:
- Gzip compression level 6 — compresses all files larger than 256 bytes
- Font caching for 1 year — fonts do not change often, so long cache lifetimes are appropriate
- Image caching for 30 days — a balance between performance and update freshness
- Next.js hashed assets for 1 year — files with hashes in their URLs change names when content changes, making long-term caching safe
- SPA routing — ensures client-side navigation works correctly
- Security headers — disables server tokens and avoids exposing unnecessary information
Health checks — a system that monitors itself
Every service has health checks that Kubernetes uses to make decisions:
| Service |
Endpoint |
Readiness |
Liveness |
| Web |
/healthz |
Every 5 sec (fail after 3) |
Every 30 sec |
| API |
/health |
Every 10 sec (fail after 3) |
Every 30 sec |
| PostgreSQL |
pg_isready |
Built-in |
Built-in |
If a health check fails, Kubernetes will:
- Readiness fail → stop routing traffic to that pod
- Liveness fail → restart the pod automatically
No one has to sit and watch it — the system takes care of itself.
Results
This pipeline enables us to:
- Deploy anytime — no manual waiting steps
- Deploy with confidence — every PR passes build validation and Lighthouse before reaching production
- Rollback instantly — every version is tagged, so we can return to a previous version with a single command
- Maintain zero downtime — rolling updates mean users never notice a deployment
- Stay traceable — manifests in Git always show the current state of production
All of this happens in about 5 minutes from git push --tags to live on enersys.co.th — down 38% from the 8.5-minute average on GitHub-hosted runners, with the 15–19 minute spikes eliminated entirely.
Sources