It started with a single sentence over lunch
"Hey, do you all realize that the font on our website has no loops?"
Not the headline — we mean Thai letters that traditionally have small looped marks at the top of characters.
The font we were using was a loopless Thai font, which looked clean and elegant to a designer’s eye. But the question that followed was:
"Can Thai readers actually read a loopless font as quickly as a looped one?"
That sentence was like striking a match in the middle of the lunch table. Our Data Science team turned it into a testable hypothesis that same afternoon.
A hypothesis that had to be proven
The team defined the hypothesis clearly:
H₀ (Null): Font choice has no effect on reading behavior — users in both groups behave no differently
H₁ (Alternative): A looped font is more comfortable to read, leading readers to go deeper, stay on the page longer, and engage more
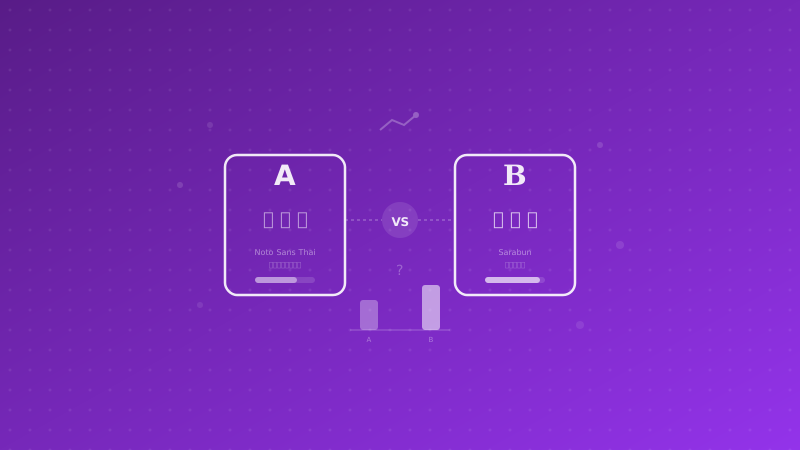
We selected a looped font designed for on-screen reading as the challenger — with a full range of weights like the original font, support for both Thai and English, and a fair basis for comparison.
| Attribute |
Control (A) |
Variant (B) |
| Letterform style |
Loopless |
Looped |
| Character |
Geometric, clean |
Humanist, easy to read |
| x-height |
Medium |
Slightly higher |
| Glyph width |
Narrower |
Slightly wider |
Measured from real behavior, not surveys
This is where we differ from most companies — we did not create a survey and ask people, "Which font do you prefer?" We measured real behavior from real users on a real website.
Experiment grouping
The system we built did three things:
- Automatic randomization: Every user was randomly assigned to group A or B with equal probability
- Persistent assignment: Once assigned, the system remembered it — returning visitors saw the same font again, preventing a novelty effect
- No flash: The font loaded from the start, so users had no idea they were part of an experiment
What we measured
Knowing who was in which group was not enough — we also had to measure how behavior differed:
Reading depth — How far did users scroll? If one group consistently scrolled deeper than the other, it would indicate that the font affected engagement.
Time spent reading — How long did users stay on the page? If the group using the looped font stayed significantly longer, it would suggest the font made reading more comfortable and encouraged continued reading.
CTA clicks — Did the font affect conversion? We measured clicks on key buttons such as Contact Us, Careers, or Read More Articles.
Everything was automatically collected in the analytics system and analyzed in segments based on the experiment groups.
Statistical rigor
We set the rules before the experiment began — not after:
- Sample size: At least 1,000 sessions per group required (80% statistical power, 5% significance level)
- Duration: Run for at least 2 full weeks to cover both weekdays and weekends
- Decision framework: Only make a change if p-value < 0.05 and effect size > 5%
There was no "checking the results along the way" — we set a calendar reminder for the analysis date to avoid peeking bias, a common trap that leads many A/B tests to the wrong conclusion.
Why this kind of thing matters
Some readers may think, "It’s just a font — why go this far?"
The answer is: we did not do this because fonts are that important. We did it because the culture of asking questions and proving them with data matters more.
Imagine this: if the same team can form a hypothesis about the font on its own corporate website and design an experiment all the way to statistical significance within a single afternoon — imagine what that team can do when a client says, "Our conversion rate is low. Can you take a look?"
Every client project we do uses the same way of thinking:
- Form a falsifiable hypothesis
- Design a measurable experiment
- Collect data systematically
- Analyze with statistical rigor
- Make decisions based on data, not gut feeling
What Data Scientists at Enersys do every day
The font experiment is only a small example of what our team does. On any given day, we analyze data across levels such as:
Product Analytics: Which features do users use most? Where do they drop off? Which onboarding flow delivers better retention?
Content Optimization: What kind of content do people finish reading? Which CTA converts better? Everything is backed by data.
Infrastructure Insights: How does each deployment affect user experience? In which direction is website speed changing?
Business Intelligence: Which lead source has the highest conversion rate? Which campaign has the lowest cost? Which content topics attract the most qualified leads?
Business impact
"So how does this impact the business?" — the best question an executive can ask
Short term: If a looped font increases reading time by 20% → more people see the CTA → lead generation increases without spending a single additional dollar on ads
Long term: A culture of experimentation creates a team that never stops improving. Every week brings a new hypothesis, every month a new insight, and every quarter new data-backed decisions that make the product better.
What clients get: When clients hire Enersys, they do not just get "a team that writes code well" — they get a team that thinks systematically, measures effectively, and never makes decisions based on gut feeling. A team willing to A/B test the font on its own corporate website will take a client’s conversion funnel seriously — the answer is already in this article.
Want your team to make decisions like this based on data?
If you have read this far and thought, "Our team should be doing this too" — we would be happy to help.
Whether you need analytics infrastructure, an A/B testing framework, or a more data-driven culture for your team, we have done it for our own company and are ready to do it for clients too.
Talk to our Data team →